The 2020 election is coming up, and every presidential election cycle the non-profit and non-partisan group AAPI Data does their Asian American Voter Survey (AAVS). 2020 is no different, and AAPI Data released the results of their survey recently. The two results I’m always interested in are the presidential race and the party identification.
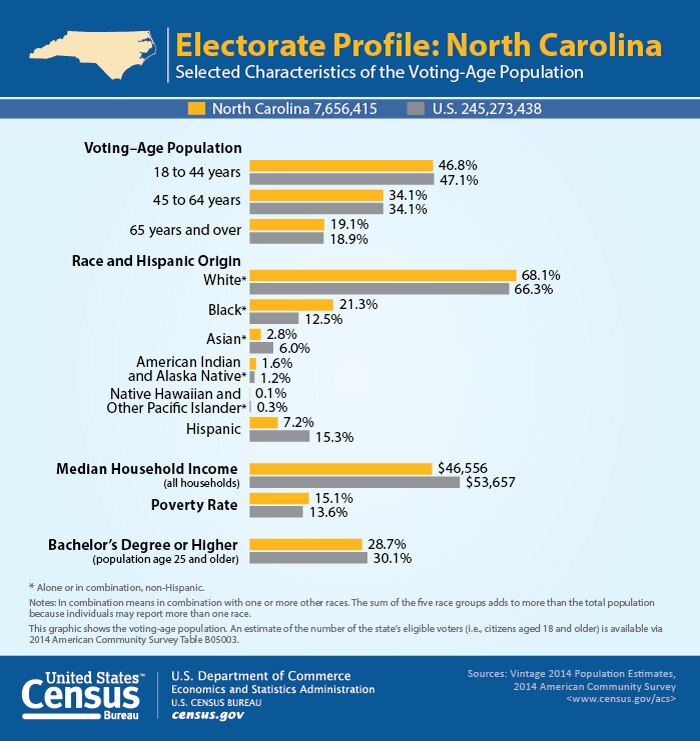
According to AAPI Data, Asian Americans constitute a critical mass in several competitive states, including Arizona (4.3% of the electorate in 2016), Pennsylvania (6.4% of the electorate in 2016), and North Carolina (3.2% of the electorate in 2016). Although the percentages are relatively small, these are swing states. Remember that in 2016:
“The most important states, though, were Michigan, Pennsylvania and Wisconsin. Trump won those states by 0.2, 0.7 and 0.8 percentage points, respectively — and by 10,704, 46,765 and 22,177 votes. Those three wins gave him 46 electoral votes; if Clinton had done one point better in each state, she’d have won the electoral vote, too.”
Asian Americans tend to vote way less than your average American, but then lean Democratic (where in 2016, 69% voted for Clinton where 25% voted for Trump, based on one study).
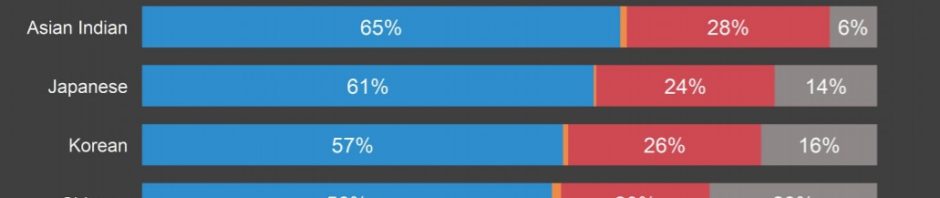
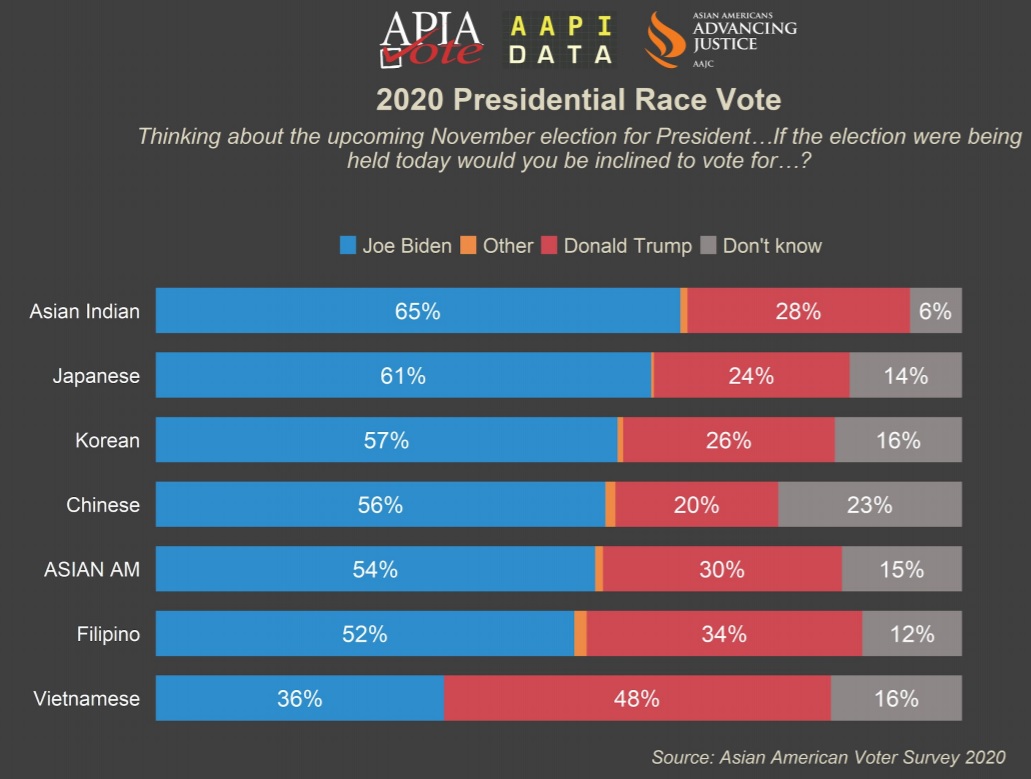
In 2020, it’s no surprise from above that Asian Americans prefer Biden (54%) over Trump (30%), as increasingly, Asian Americans have been voting for Democrats over the past 30 years. Personally, I can’t believe that 15% of Asian Americans don’t know who their preference is … No surprise, Vietnamese Americans prefer Trump over Biden, as I imagine the older generation, having traditionally been very conservative given the Communist takeover of South Vietnam. But I am sure the younger Vietnamese Americans, over time, may become more Democratic in their voting.
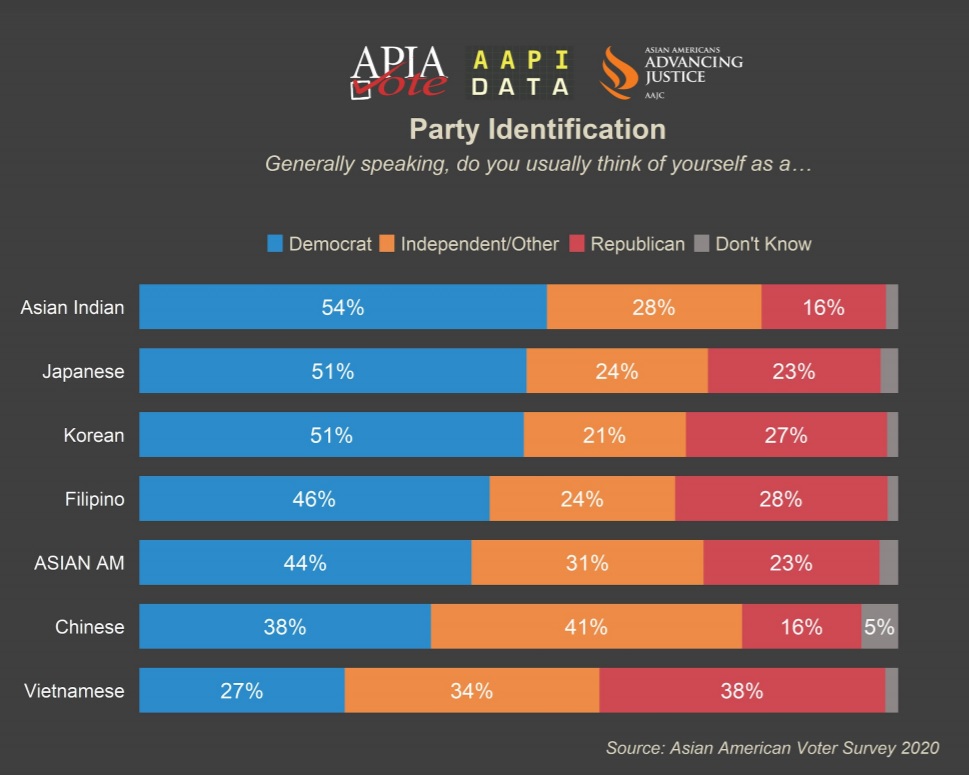
Overall, Asian Americans identify more as Democrats (44%) over being Republicans (23%) – with a larger percentage preferring to remain Independent – an increasing trend among younger voters who have dissatisfaction with both parties.
If you want a copy of the summary slides of the result of the survey, you can get them here. – as well as the executive summary here.


